Nearly a third of midterm votes now come from the over-65s
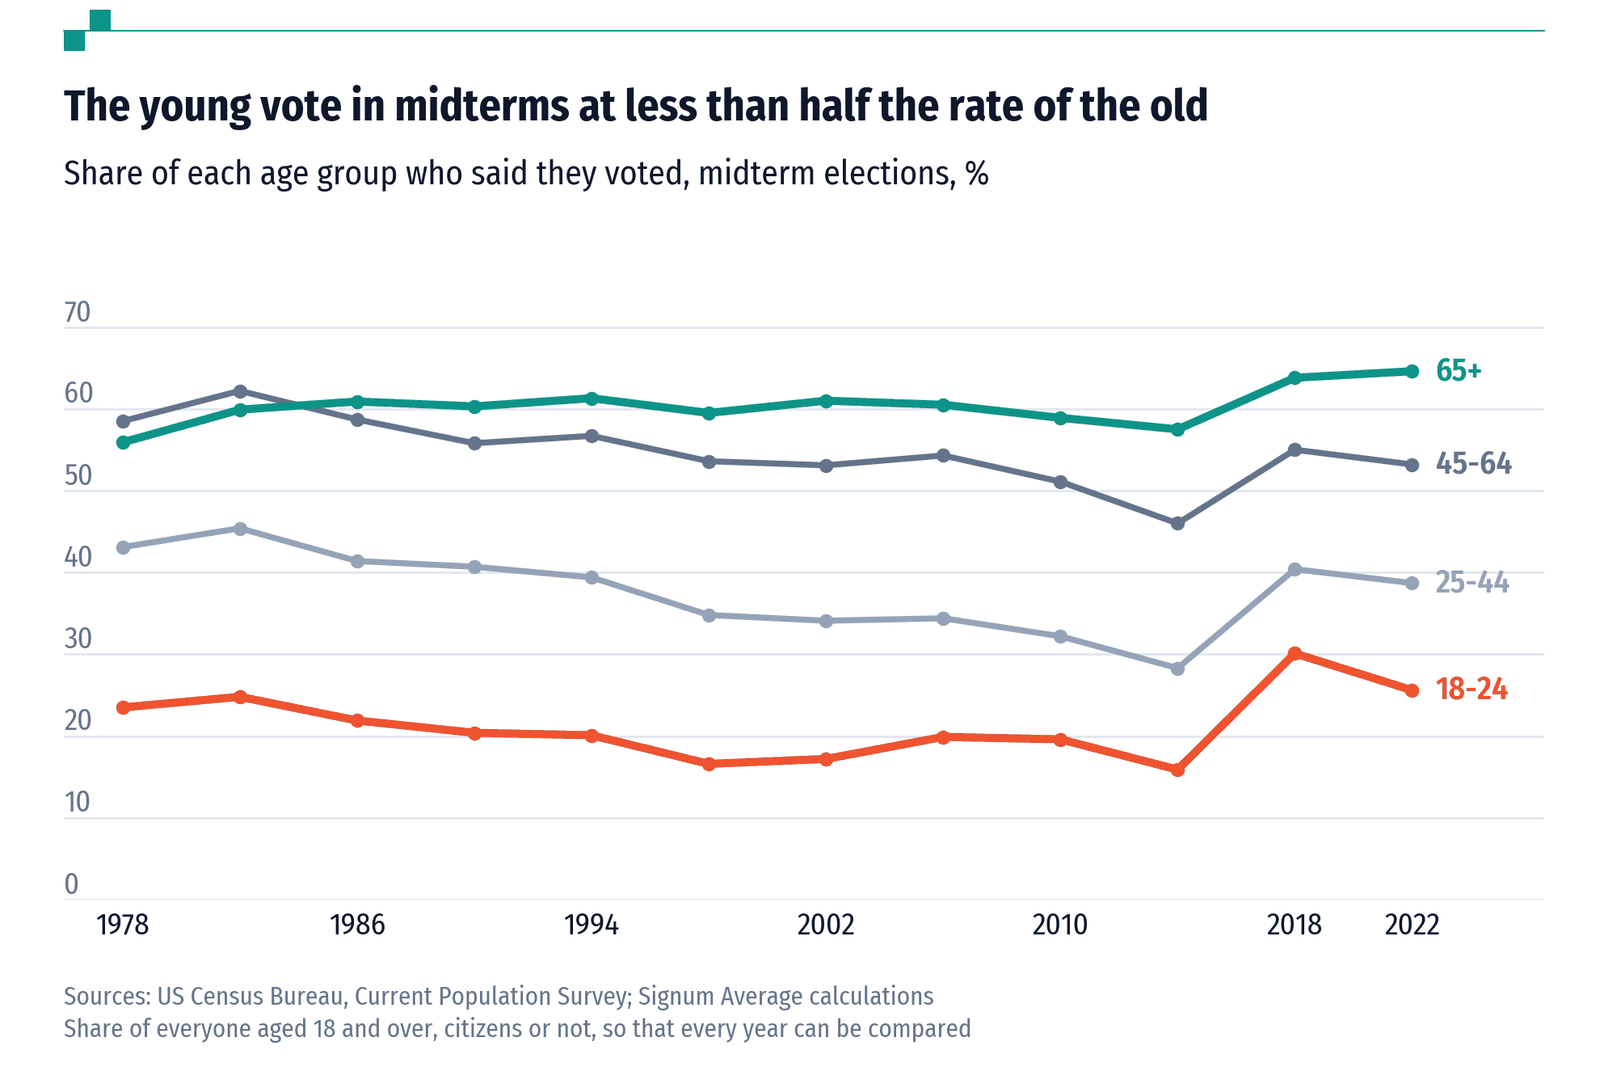
In 2022, 65% of Americans aged 65 and over said they voted, against 26% of those aged 18 to 24. An ageing country explains most of the shift in who decides midterms; turnout explains the rest
After every November election since 1964 the Census Bureau has asked tens of thousands of households whether each adult in them voted. The answers, which go back to the midterms of 1966, show who turns up when the presidency is not on the ballot. Before Tuesday's midterms we went through every one since 1978.
The age gap is enormous. In 2022, 65% of Americans aged 65 and over said they voted, against 26% of those aged 18 to 24. The young have voted at less than half the rate of the old in every midterm in the record. Their best year was 2018, at 30%; their worst was 2014, at 16%. In 1978 the over-65s still voted less than people aged 45 to 64. Since 1986 they have voted most.
An older electorate
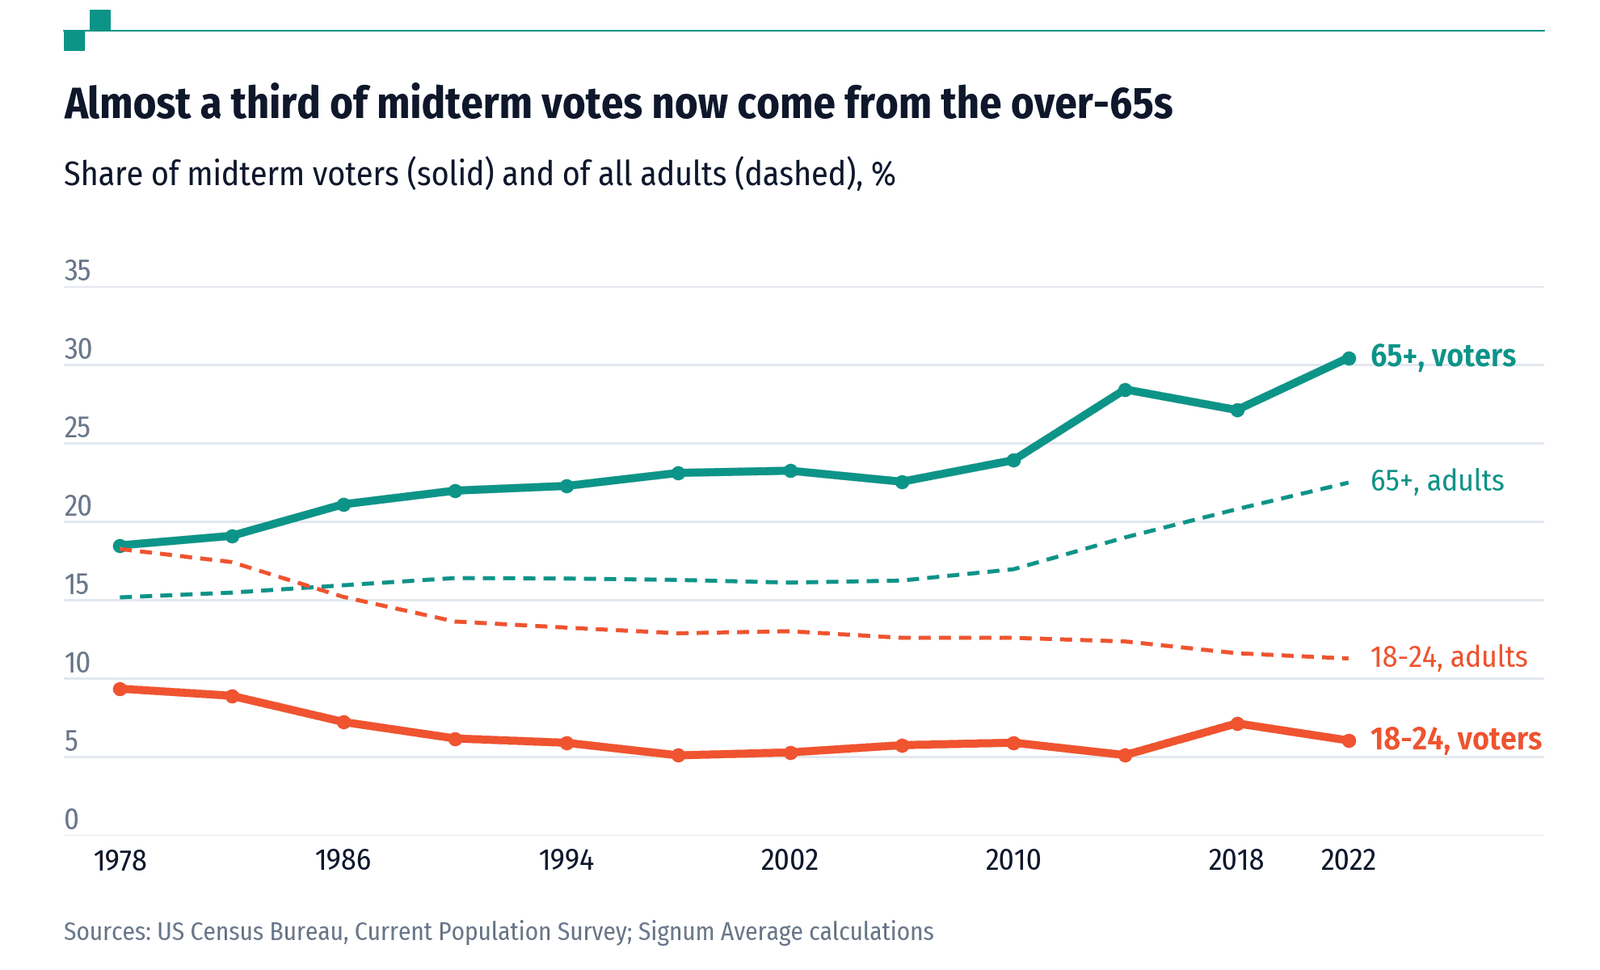
Higher turnout and an ageing country add up. Americans aged 65 and over cast 18% of the votes in the 1978 midterms and 30% in 2022, the most in the record, though they are only 22% of adults. Those aged 18 to 24 cast 9% of the votes in 1978 and 6% in 2022.
Most of that shift comes from age itself. Had each group voted at its 1978 rate, the over-65s would still have cast 26% of the votes in 2022, simply because there are so many more of them. Had the population kept its 1978 shape, their higher turnout alone would have lifted them only to 22%.
The young also drop away most when the White House is not at stake. In 2022, 18-to-24s voted at 53% of their rate in the presidential election two years before; the over-65s at 90%. That pattern has held in every midterm since 1978. It came closest to closing in 2018, the year of the youth surge, when the young voted at 76% of their 2016 rate.
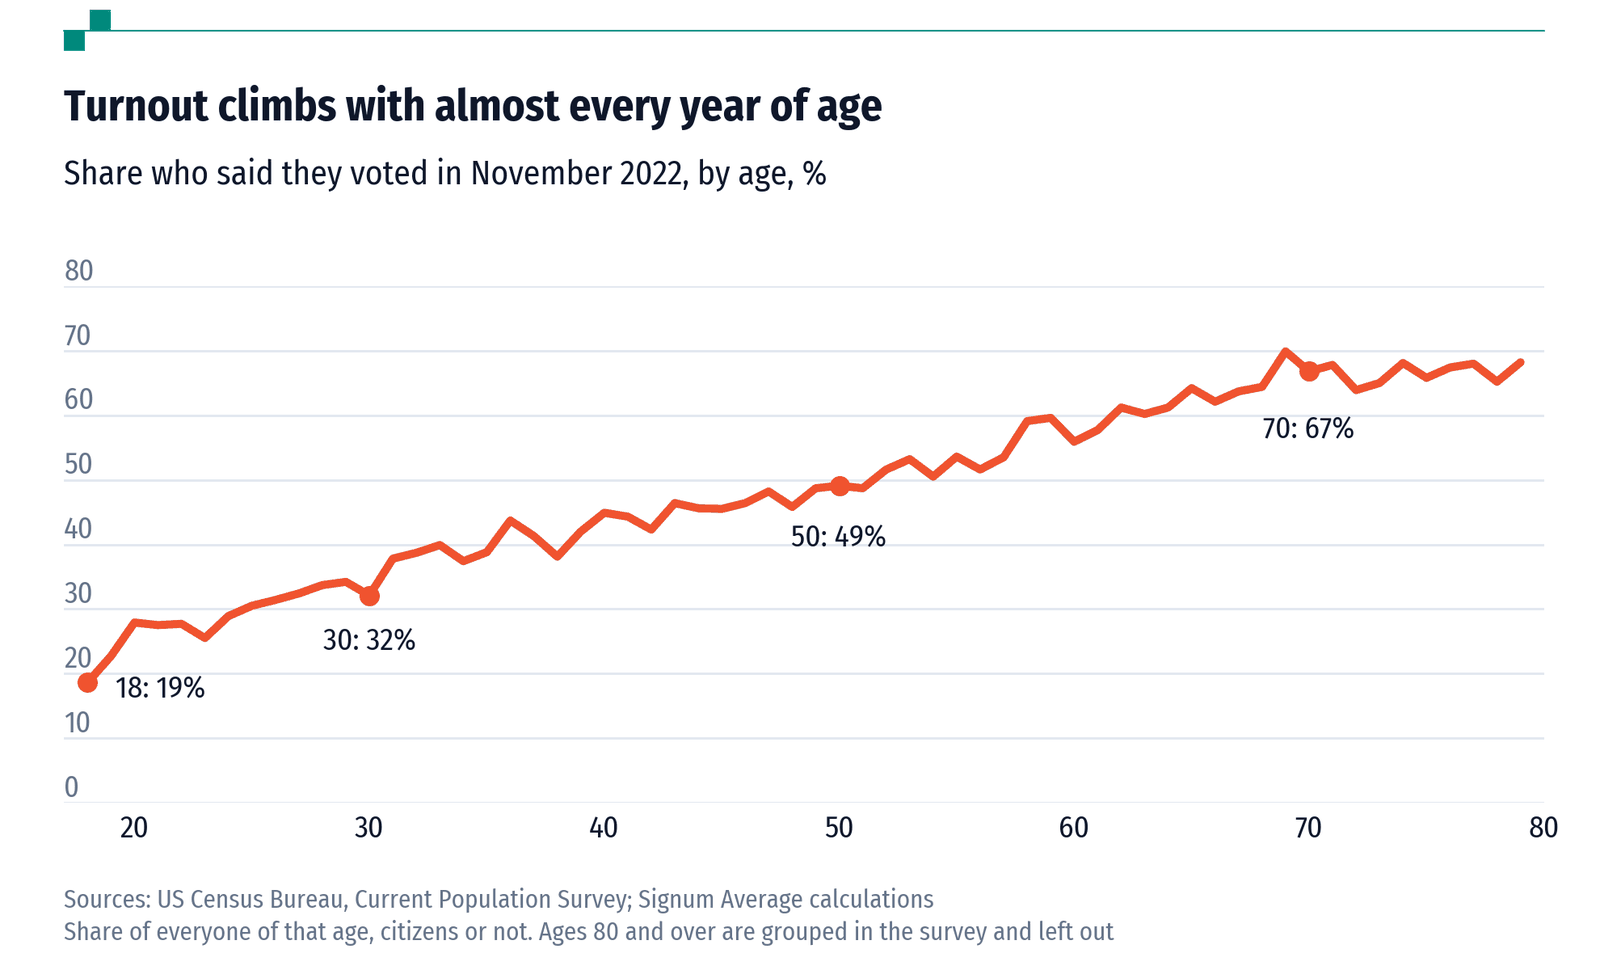
Turnout rises with almost every year of age. In 2022, 19% of 18-year-olds said they voted, 32% of 30-year-olds, 49% of 50-year-olds and 67% of 70-year-olds.
How far to trust a survey
People tell surveys they voted when they did not. In 2022, 52% of citizens told the Census Bureau they had voted. The votes actually counted, set against everyone eligible, give 46%, according to the University of Florida's Election Lab. The gap was about ten points in the 1980s and has been three to six since 1998.
The bureau also counts people who gave no answer as not having voted, and the young skip the question most: 22% of citizens aged 18 to 24 in 2022, against 14% of those over 65. Leave the non-answers out and every group's turnout rises, to 35% for the young and 78% for the old. The gap does not close; it widens slightly, from 39 points to 42. Measuring turnout among citizens rather than all adults moves it by less than a point in any year since 2002.
None of this predicted Tuesday's result; our forecast, and how it fared, is scored separately. But the result was decided by an electorate that is older than the country.
Data
Reported turnout by age, every November election
Share of each age group who said they voted, of all adults and of citizens, with the group's size. Coverage: 1976-2022. Source: US Census Bureau; own calculations. turnout_by_age.csv
Who makes up the midterm electorate, by age
Each age group's share of reported midterm voters and of all adults. Coverage: Midterms 1978-2022. Source: US Census Bureau; own calculations. electorate_shares.csv
How much each age group falls away in midterms
Midterm turnout divided by turnout in the presidential election two years before, by age. Coverage: Midterms 1978-2022. Source: US Census Bureau; own calculations. drop.csv
Reported turnout by single year of age, 2022
Share who said they voted in the 2022 midterms, by single year of age (80 and over grouped). Coverage: November 2022. Source: US Census Bureau; own calculations. single_ages_2022.csv
How far the survey overstates turnout
Survey turnout and its gap to turnout counted from votes cast against the voting-eligible population (University of Florida Election Lab). The Election Lab's own figures are not republished; see its site. Coverage: Midterms 1982-2022. Source: US Census Bureau; own calculations. check_overreport.csv
Turnout with and without the people who gave no answer
Share of citizens who gave no answer on voting, turnout as the Census Bureau counts it, and turnout among those who answered, by age. Coverage: Midterms 2014, 2018, 2022. Source: US Census Bureau; own calculations. check_no_answer.csv
The age gap on citizens and on all adults
Turnout of over-65s minus turnout of 18-to-24s, measured among all adults and among citizens. Coverage: Midterms 2002-2022. Source: US Census Bureau; own calculations. check_citizens.csv
All the files, with a README that explains every column, are in the data on GitHub, free to reuse with credit (CC BY 4.0).
Cite this work
Our articles and data visualisations rely on work from many sources. When citing this article, please also cite the underlying data sources, listed with the data.
Signum Average (2026) - "Nearly a third of midterm votes now come from the over-65s" Published online at signumaverage.com. Retrieved from: https://signumaverage.com/articles/midterm-turnout/ [Online resource]
@article{signumaverage-2026-10-30-midterm-turnout,
    author = {{Signum Average}},
    title = {Nearly a third of midterm votes now come from the over-65s},
    journal = {Signum Average},
    year = {2026},
    month = {oct},
    url = {https://signumaverage.com/articles/midterm-turnout/},
    note = {Online resource}
}
Reuse this work freely
Text, charts and data on this page are published under the CC BY 4.0 licence: you may copy, adapt and republish them for any purpose, as long as you credit Signum Average. Third-party data keeps its original licence.