We called the midterms but missed the wave
Our forecast gave the Democrats the Senate and the House. They won both, by far more than we said. In the Senate the polls on their own did better than our model, and the betting market did better still
On 16 October, 18 days before the midterms, we published our own forecast of every Senate and House race, built from the polls and past results and no one else's numbers. We promised to score it against the results and against the betting market. With 33 of the 35 Senate races and 419 of the 435 House seats called, here is the score.
We picked the right winner in both chambers. Our final forecast, issued on election day, gave the Democrats a 62% chance of taking the Senate and 83% for the House. They have won 54 Senate seats, with Mississippi and Alaska still counting, and at least 256 House seats. But we missed the size of it badly. Our most likely outcome was 51 Senate seats and 227 in the House. We gave the Democrats a 13% chance of 54 or more senators and a 2.1% chance of 256 or more House seats.
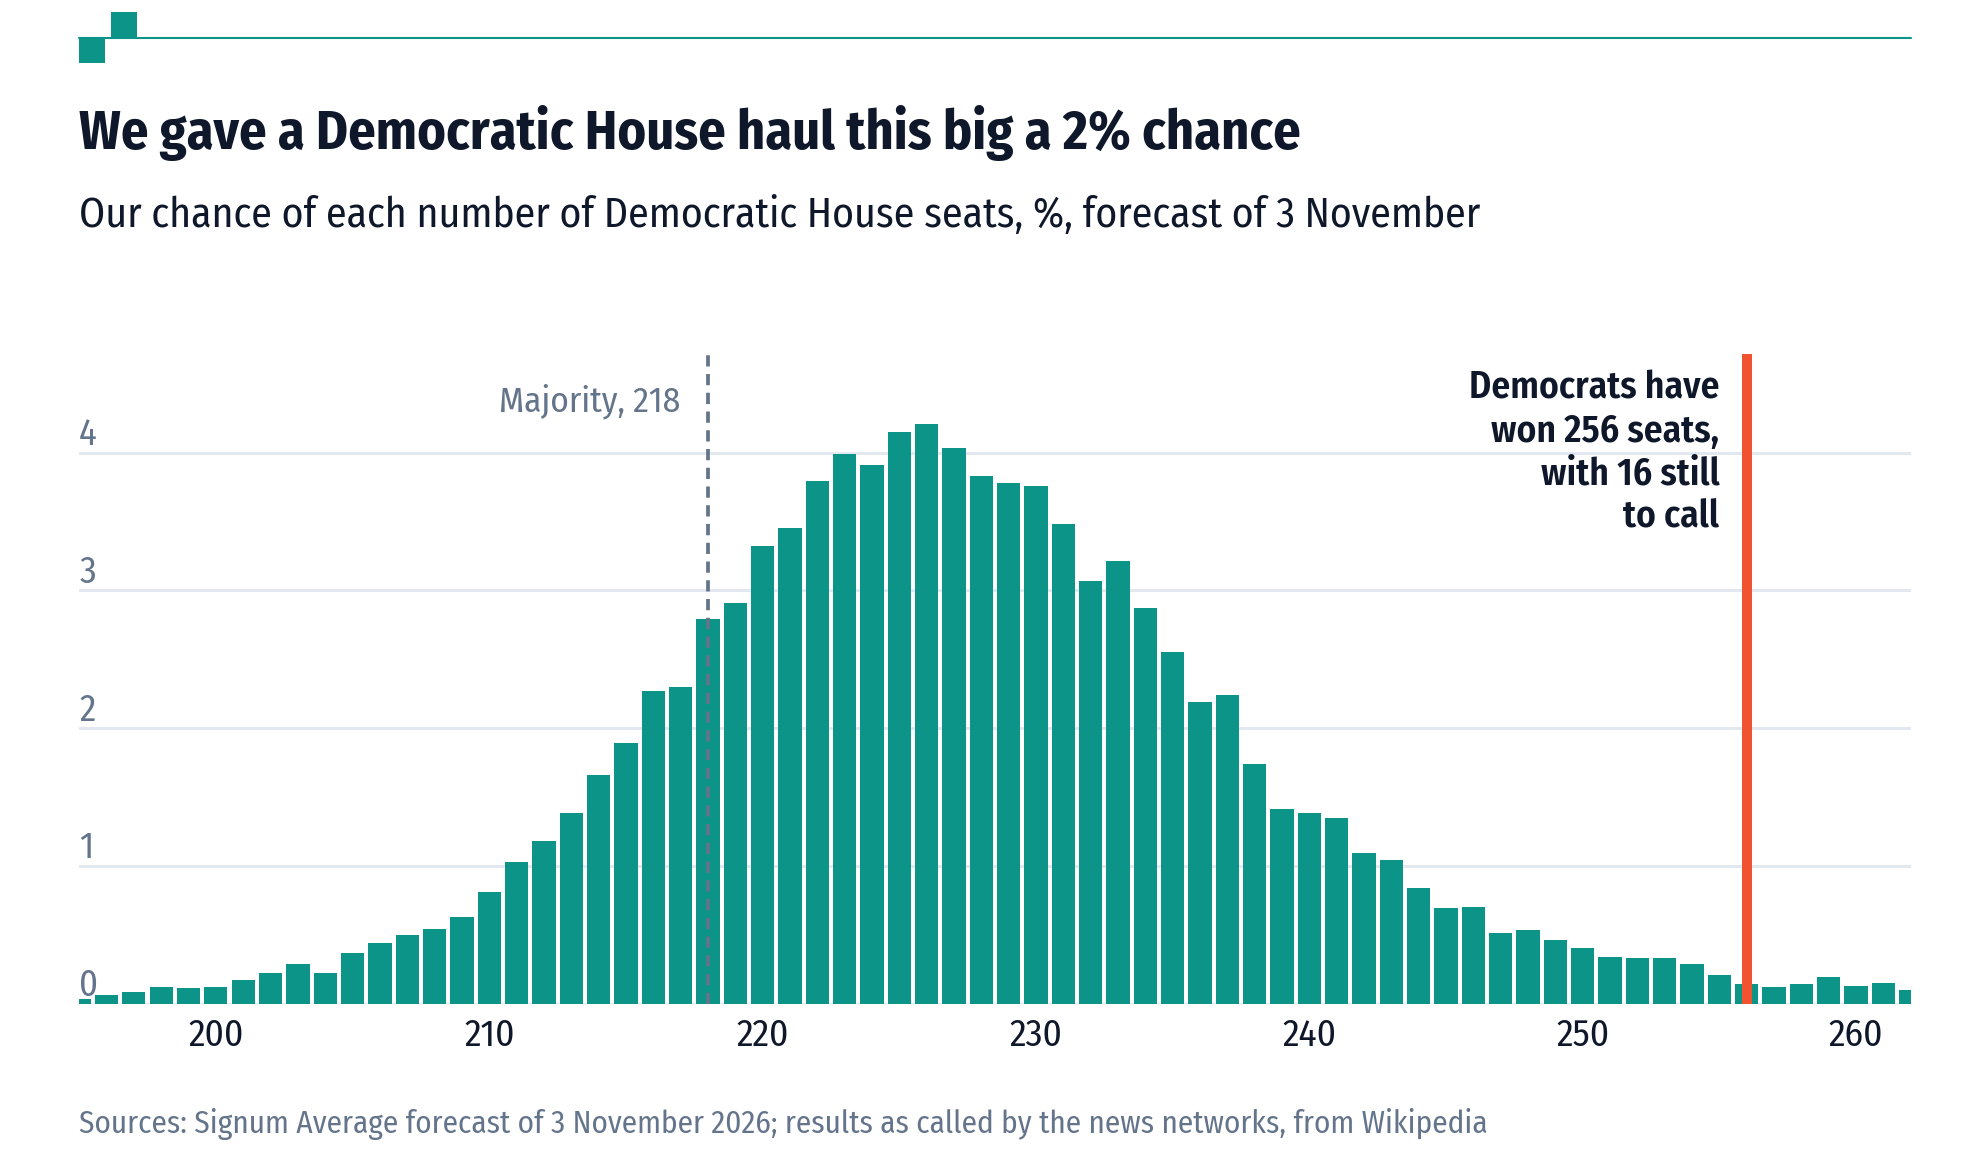
A miss in one direction
The error ran all one way. In each of the 16 Senate races whose vote counts are in, the Democrats did better than we forecast, by 6.3 points on average. Only nine of those results fell inside the ranges we gave as 80% likely; a well-calibrated forecast would have caught about 13. In the House we called 35 districts wrong, and every one of them went to the Democrats, including four in North Carolina that lean Republican by eight or nine points.
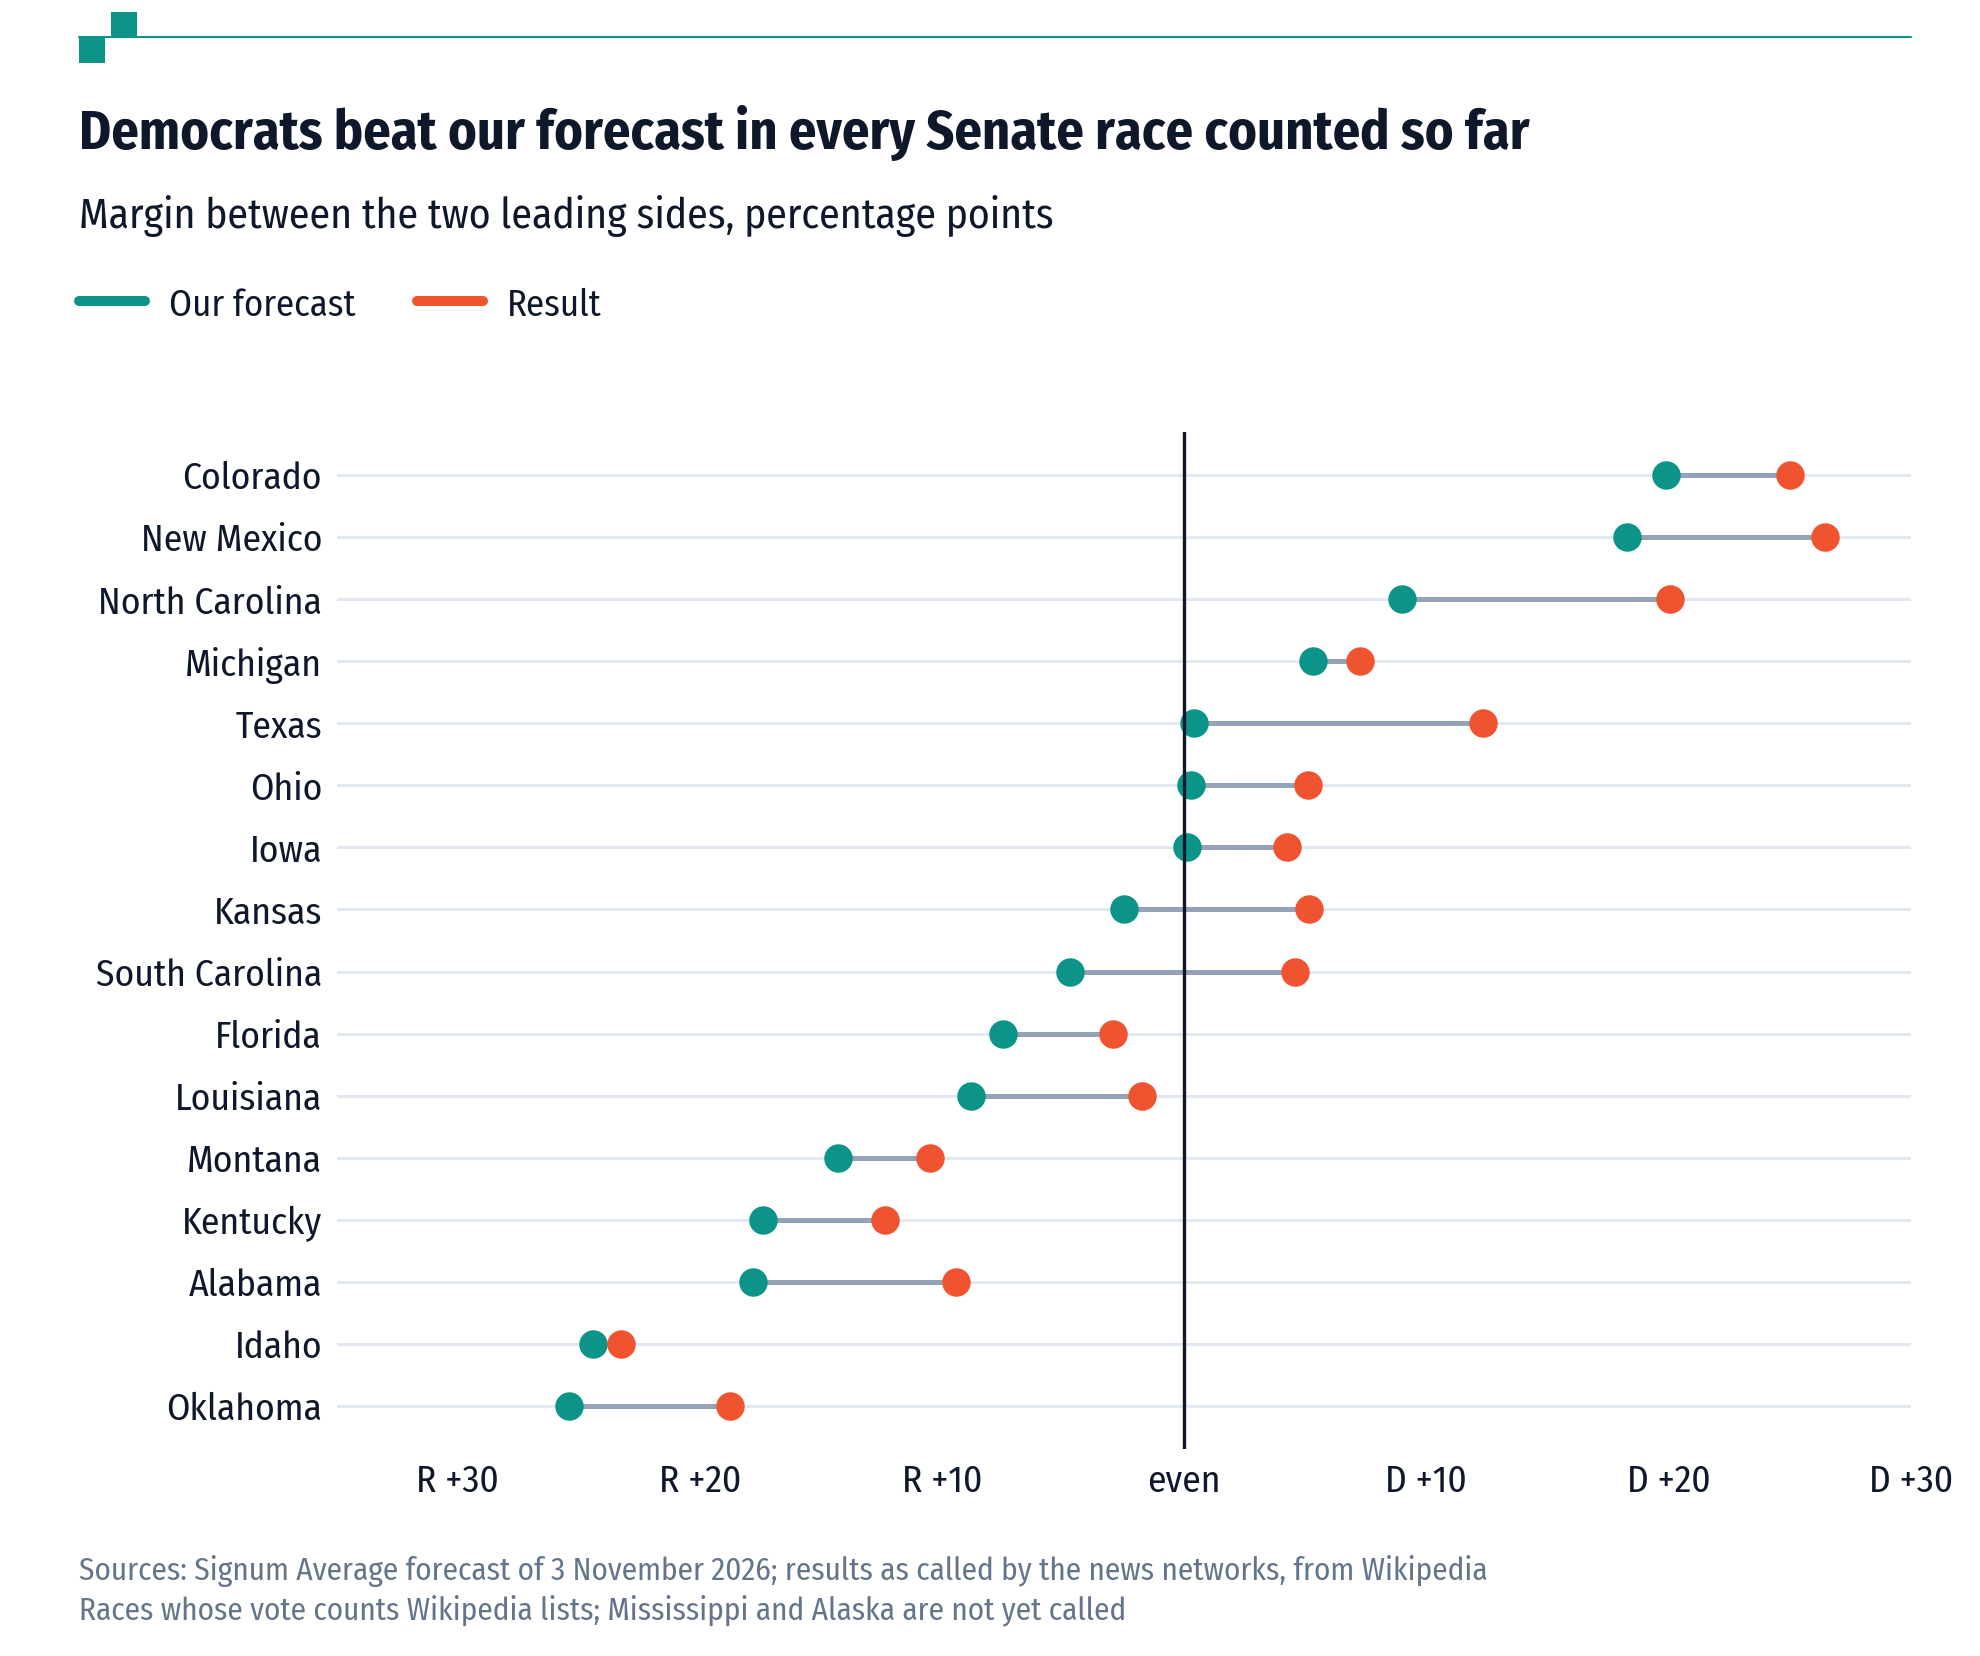
That pattern points to one shared error rather than many local ones. Our House model fits the results only if the national mood is shifted about eight points towards the Democrats, from the 6.3-point lead in the generic-ballot polls that we used to roughly 14.
The polls did better on their own
Part of the miss was the polls'. In the 16 counted Senate races they understated the Democrats by five points. Part of it was ours. Our model blends each race's polls with how the state has voted before, because in past elections that blend beat the polls alone. This year it pulled two races the wrong way. South Carolina's polls had Annie Andrews level and Kansas's had Adam Hamilton three points ahead; the state's history pulled both towards the Republicans, and we gave them 13% and 26%. Both won by about five points. In all 28 Senate races with polls, the candidate leading the polling average won. Our model called 26 of them right.
In our test on the elections of 2018 to 2024, the blend scored better than the polls overall but only tied them in midterm years. Midterms are when it should have been trusted least, and that is where it failed.
One decision we got right. In 2020, 2022 and 2024 the polls overstated the Democrats by about four points, and we tested correcting for that. We dropped the correction because the lean came from presidential years and made our midterm calls worse in the test. Had we kept it, our Senate forecast would have been 27% for the Democrats rather than 62%, and it would have called five races wrong instead of two.
The market beat us
Polymarket, a betting market, gave the Democrats 74% for the Senate and 94% for the House just before the first polls closed, more than we did in both. Race by race, it was better too. We scored both forecasts with the Brier score, the average squared distance between the stated chance and what happened (0 is perfect; saying 50% every time scores 0.25). Across the 32 Senate races where Polymarket traded, the market scored 0.040 and our model 0.063. Our score in the 2018-2024 test was 0.041.
| State | Our model | Market | Polls | Winner |
|---|---|---|---|---|
| Michigan | 90% | 77% | D +4.7 | Democrat |
| Maine | 91% | 71% | D +3.8 | Democrat |
| Texas | 54% | 77% | D +3.1 | Democrat |
| Ohio | 53% | 73% | D +4.6 | Democrat |
| Iowa | 51% | 51% | D +2.5 | Democrat |
| Kansas | 26% | 65% | D +3.1 | Democrat |
| South Carolina | 13% | 31% | D +0.4 | Democrat |
| Nebraska | 7% | 29% | R +0.7 | Republican |
Polls: our average of the two-party margin. Nebraska's Democratic side is Dan Osborn, an independent. Market: Polymarket, last hourly price before 23:00 GMT on 3 November. Sources: Signum Average; Polymarket; Wikipedia
The market was more hopeful for the Democrats than we were in every close race in a state that usually votes Republican, and it missed only South Carolina. Where we were surer than the market, in Maine and Michigan, we were right. But those were safe calls, and the market's caution cost it little.
This was our first election forecast, and the question it had to answer was who would win. It answered correctly in both chambers. It answered the next question, by how much, worse than the polls it was built on. The tracker is now closed. Every race's forecast and result is in the data below, and we will add Mississippi, Alaska and the last House seats as they are called.
Data
Our 2026 Senate forecast against the results
Every 2026 Senate race: our final forecast of 3 November, the polling average, and the result as called. Coverage: 2026. Source: Signum Average forecast; Wikipedia. midterms_senate_scorecard.csv
Our 2026 House forecast against the results
Every House district on the 2026 maps: our final forecast of 3 November and the winning party as called. Coverage: 2026. Source: Signum Average forecast; Wikipedia. midterms_house_scorecard.csv
All the files, with a README that explains every column, are in the data on GitHub, free to reuse with credit (CC BY 4.0).
Cite this work
Our articles and data visualisations rely on work from many sources. When citing this article, please also cite the underlying data sources, listed with the data.
Signum Average (2026) - "We called the midterms but missed the wave" Published online at signumaverage.com. Retrieved from: https://signumaverage.com/articles/midterms-scorecard/ [Online resource]
@article{signumaverage-2026-11-06-midterms-scorecard,
    author = {{Signum Average}},
    title = {We called the midterms but missed the wave},
    journal = {Signum Average},
    year = {2026},
    month = {nov},
    url = {https://signumaverage.com/articles/midterms-scorecard/},
    note = {Online resource}
}
Reuse this work freely
Text, charts and data on this page are published under the CC BY 4.0 licence: you may copy, adapt and republish them for any purpose, as long as you credit Signum Average. Third-party data keeps its original licence.