Gulf oil is going round Hormuz, not through it
The Gulf is exporting nearly as much oil as before the war. But almost half of it now leaves outside the Strait of Hormuz, by detours that have been bombed, rerouted and hidden from view
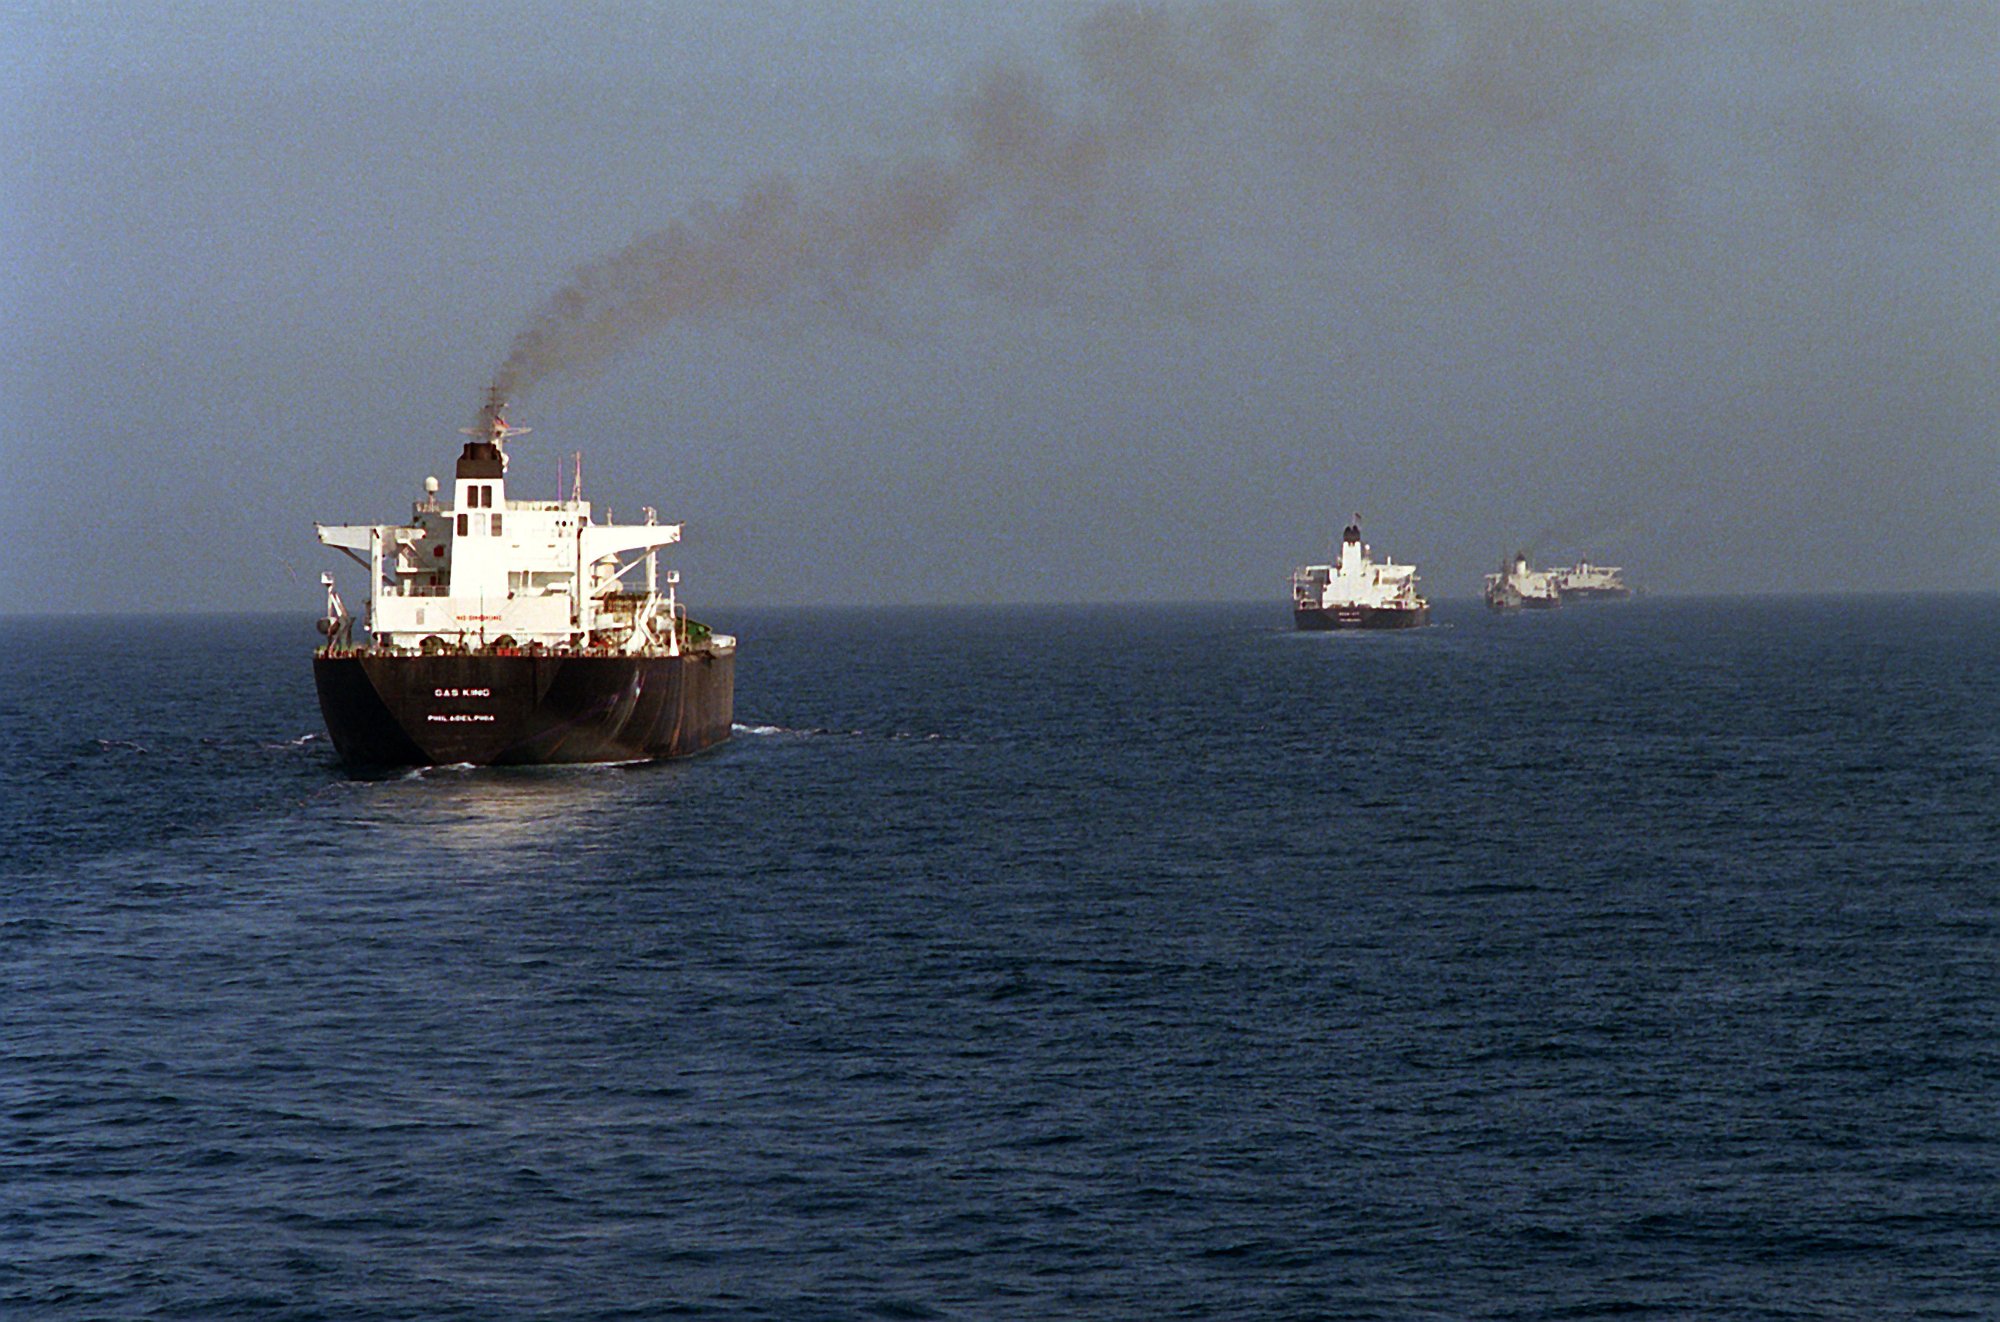
On 21 October the Wall Street Journal reported that oil leaving the Middle East had climbed back above its pre-war level. Kpler, a firm that tracks tankers, counted more than 24m barrels a day in the week to 18 October, against 23.3m before America, Israel and Iran went to war in February. Other outlets carried the same figure under headlines saying Gulf oil was flowing again despite Iran's attacks on ships.
Yet a barrel of Brent crude cost $115 on 20 October, against $71 in February. If the oil is back, why is the price not?
Part of the answer is that the headline counts oil that never goes near the Strait of Hormuz. We collected the figures Kpler and others have made public, IMF PortWatch's ship counts and US government prices, and lined them up route by route. The price looks less mysterious once you follow the routes: much of the oil now leaves by detours that keep breaking.
Three ways out
Before the war almost three-quarters of the region's oil exports sailed through the strait. The rest was loaded outside it: Saudi Arabia's East-West pipeline carries crude across the desert to Yanbu on the Red Sea, the United Arab Emirates pumps oil from Habshan to Fujairah, on the Gulf of Oman, and Oman ships its own crude from terminals beyond the strait.
Kpler's 24m figure adds all three routes together. Kpler has not published how that total for the week to 18 October splits by route. Its media briefing of 14 October, covering the week before, does, so the numbers below describe a different and weaker week (16.9m barrels a day in all, against 23.3m before the war), not the composition of the later total.
In the week to 12 October 7.6m barrels a day crossed the strait directly, 44% of the pre-war 17.1m. Kpler's broader measure for the strait, which adds 1.6m a day moved from ship to ship off Oman, came to 9.3m, or 54%. Loadings outside the strait were above normal: 4.1m a day at the terminals of Fujairah and Oman (3.4m before the war) and 3.5m in the Red Sea (2.8m). Together they made up 45% of the region's exports, against 27% before. Not every one of those barrels came by pipeline: Oman produces oil of its own, and Kpler's Red Sea figure includes cargoes it does not assign to a route. The Wall Street Journal, using a narrower measure of crude alone, puts the share bypassing the strait at 17% before the war and 40% now.
The strait itself is harder to pin down than any headline admits. Tankers now cross at night in convoys of 15 to 20, hugging Oman's coast under American air cover, Axios reported in August, and many hand their cargo to bigger ships off Fujairah and Sohar. So the oil comes in bursts. Kpler logged 20.8m barrels on 8 October and 2.9m three days later, according to Al Jazeera. Weekly figures for the strait range from 44% of pre-war (direct transits, week to 12 October) to about 82% (crude only, week to 18 October, in the Journal's report), and they do not all measure the same thing. Anyone quoting one week as "the" state of Hormuz is reading noise.
The counts disagree for another reason too. At least six different "pre-war" baselines appear in the press, from 13.5m barrels a day (crude through the strait) to 23.3m (all routes), often without saying which. A strait at half its normal flow and a region above its pre-war total can both be reported for neighbouring weeks.
Hidden from view
If you watched the strait through free ship-tracking data, you would think it had shut. IMF PortWatch, which counts ships broadcasting their position, recorded 0.4 tankers a day crossing in the week to 12 October. Kpler, which also tracks ships with their transponders switched off, counted 13. Before the war it was about 50. The two datasets define and count crossings differently, so the gap is not an exact measure of how many tankers run dark, but it is far too wide to be explained by method alone.
The detour has gone dark too. PortWatch counted 6.6 tanker calls a day at Yanbu in June. Since August it has counted almost none, yet Kpler puts Red Sea loadings above their pre-war level. The trade journal MEES reported on 14 August that tankers at Yanbu had switched off their transponders after Yemen's Houthis declared an embargo on Saudi shipping on 20 July and began hitting Saudi tankers. Most cargoes stopped sailing south past Yemen and turned north, through Egypt's SUMED pipeline and the Suez Canal, according to Lloyd's List. The ship counts we can see agree: tanker tonnage through Bab el-Mandeb, at the southern end of the Red Sea, roughly halved in August, while Suez in October carried more tanker tonnage than in any other month this year.
When the detour breaks
The routes leave a mark on the price. The clearest sign is the gap between Brent, the benchmark for oil that travels by sea, and West Texas Intermediate (WTI), crude priced inland in America. In 2025 Brent cost $3.60 a barrel more on average. Since the war began the gap has opened twice, and both times a detour was broken.
The first was in March and April, when the strait had all but shut and the pipelines were not yet full: Fujairah's loading manifold was destroyed on 9 March. The gap reached $26. Once Saudi Arabia had the East-West line running at 7m barrels a day in April, it narrowed, and by June it had all but vanished. The second began on 10 September, when drones hit three of the pipeline's pumping stations and Saudi Arabia shut it for 11 days. The gap hit $38 on 2 October. Saudi Arabia's energy minister said on 6 October the line was back at 5.8m barrels a day, and by 20 October the gap was $7.
Timing is not proof, and other things moved at the same time: between 14 and 20 October WTI rose by $12 while Brent fell by $11, so the gap closed from both sides. But the pattern fits what the routes suggest: with the strait half open, the world depends on two pipelines with little room to spare, and route disruptions likely added to the premium on sea-borne oil. The gap explains only part of the story. Brent's rise from $71 to $115 also reflects a region still exporting less than before the war in most weeks, and everything else that moves oil prices.
Attacks on ships add to the pressure. We compiled 139 attacks, attempted attacks and seizures of ships in and around the Gulf this year from UK maritime agency warnings and news reports, 32 of them attacks in October alone. In the two trading days after an attack, Brent did three percentage points better than on other days of the war, once days with strikes or talks were set aside. Under a rule we fixed before running the test, that is suggestive, not proof (the chance of so large a gap arising by luck is about one in 20).
The oil is getting out. But more than four barrels in ten now leave by roads that have already been bombed, rerouted round a second war at sea and switched off from public view, and that have no spare lanes. The headline total says the oil is back; the routes say how fragile that is.
Cite this work
Our articles and data visualisations rely on work from many sources. When citing this article, please also cite the underlying data sources, listed with the data.
Signum Average (2026) - "Gulf oil is going round Hormuz, not through it" Published online at signumaverage.com. Retrieved from: https://signumaverage.com/articles/hormuz-oil-price/ [Online resource]
@article{signumaverage-2026-10-21-hormuz-oil-price,
    author = {{Signum Average}},
    title = {Gulf oil is going round Hormuz, not through it},
    journal = {Signum Average},
    year = {2026},
    month = {oct},
    url = {https://signumaverage.com/articles/hormuz-oil-price/},
    note = {Online resource}
}
Reuse this work freely
Text, charts and data on this page are published under the CC BY 4.0 licence: you may copy, adapt and republish them for any purpose, as long as you credit Signum Average. Third-party data keeps its original licence.