The Sun Belt filled in. The Rust Belt spread out
Fifty years of satellite maps of North America's 25 largest metro areas show the fast-growing South fitting more people onto each square metre it builds, and the old industrial North covering more ground with the same people
Satellites have photographed North America's cities since the 1970s. The European Commission's Global Human Settlement Layer turns those pictures into maps of built-up land, every five years from 1975 to 2025, and lays census counts of residents over them. We took the 25 largest metro areas of the United States, Canada and Mexico, each inside a single outline drawn the same way in all three countries, and set the land each one covers against the people living on it.
Taken together, the 25 grew almost in step. Their residents rose by 72%, from 98m to 168m, and their built-up land by 77%. City by city, the picture splits in two.
The South filled in
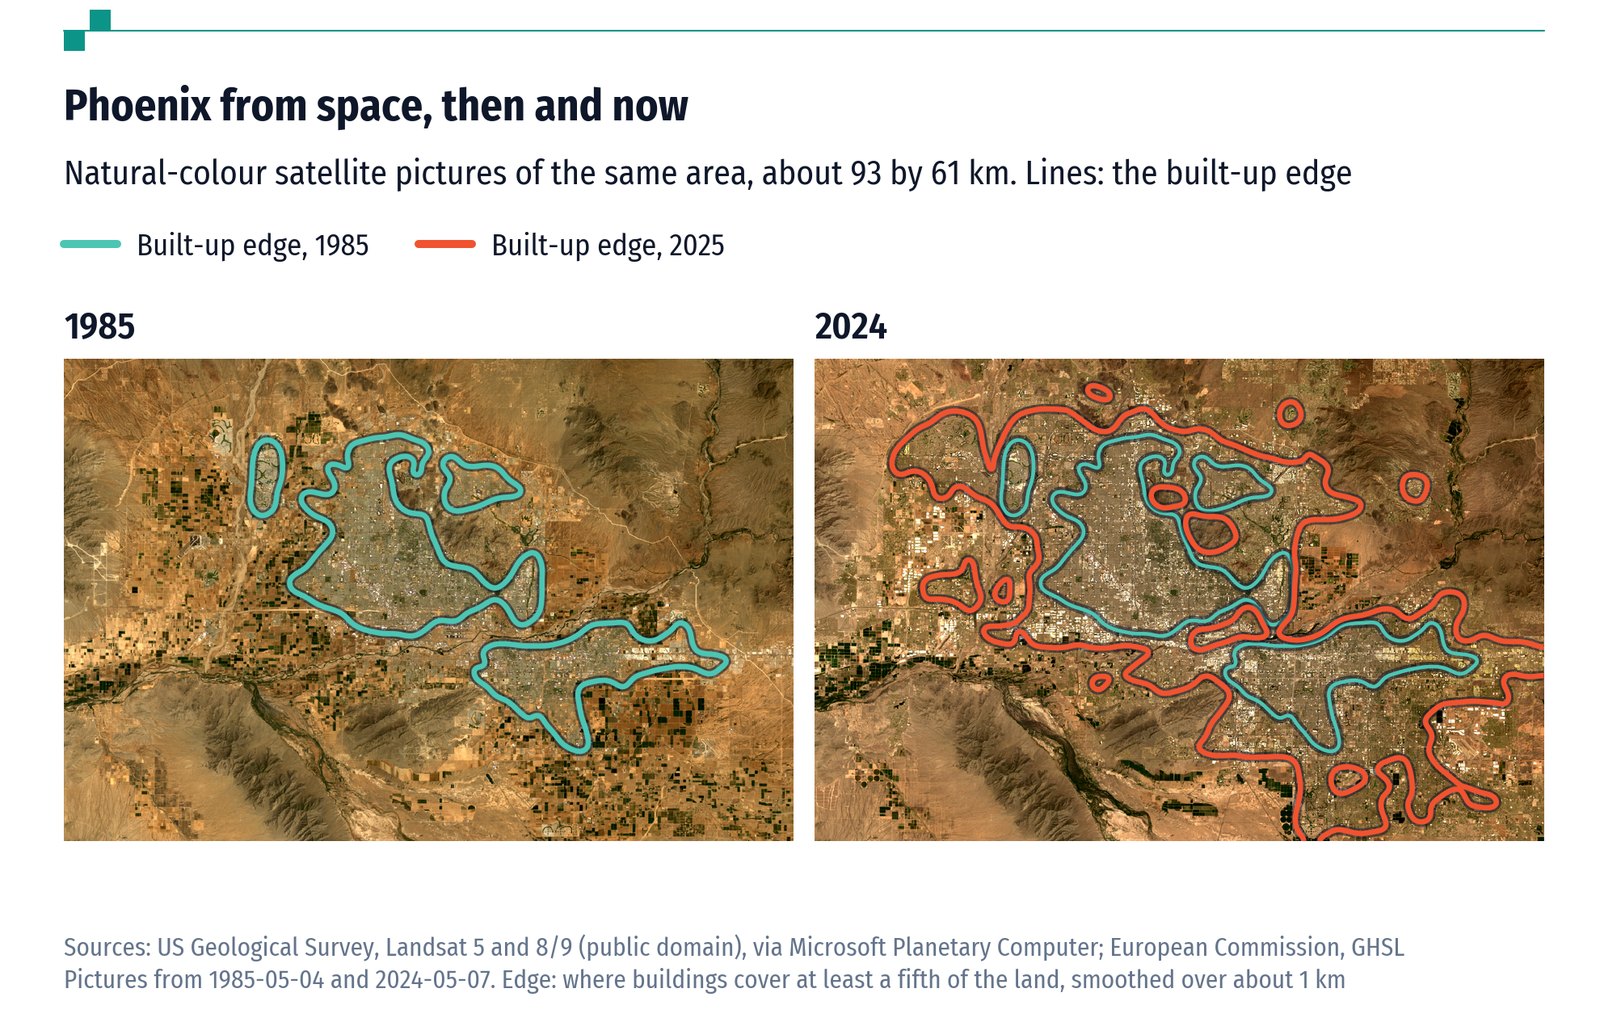
The fastest-growing metros of the American South and West started out the most spread out, and have been filling in since. Phoenix has 4.3 times as many residents as in 1975 but only 2.4 times as much built-up land, so the land it uses per resident fell from 285 square metres to 157. Tampa, Miami and Dallas followed the same course. Houston and Atlanta grew enormously in both, but more in people. So did Toronto.
The North spread out
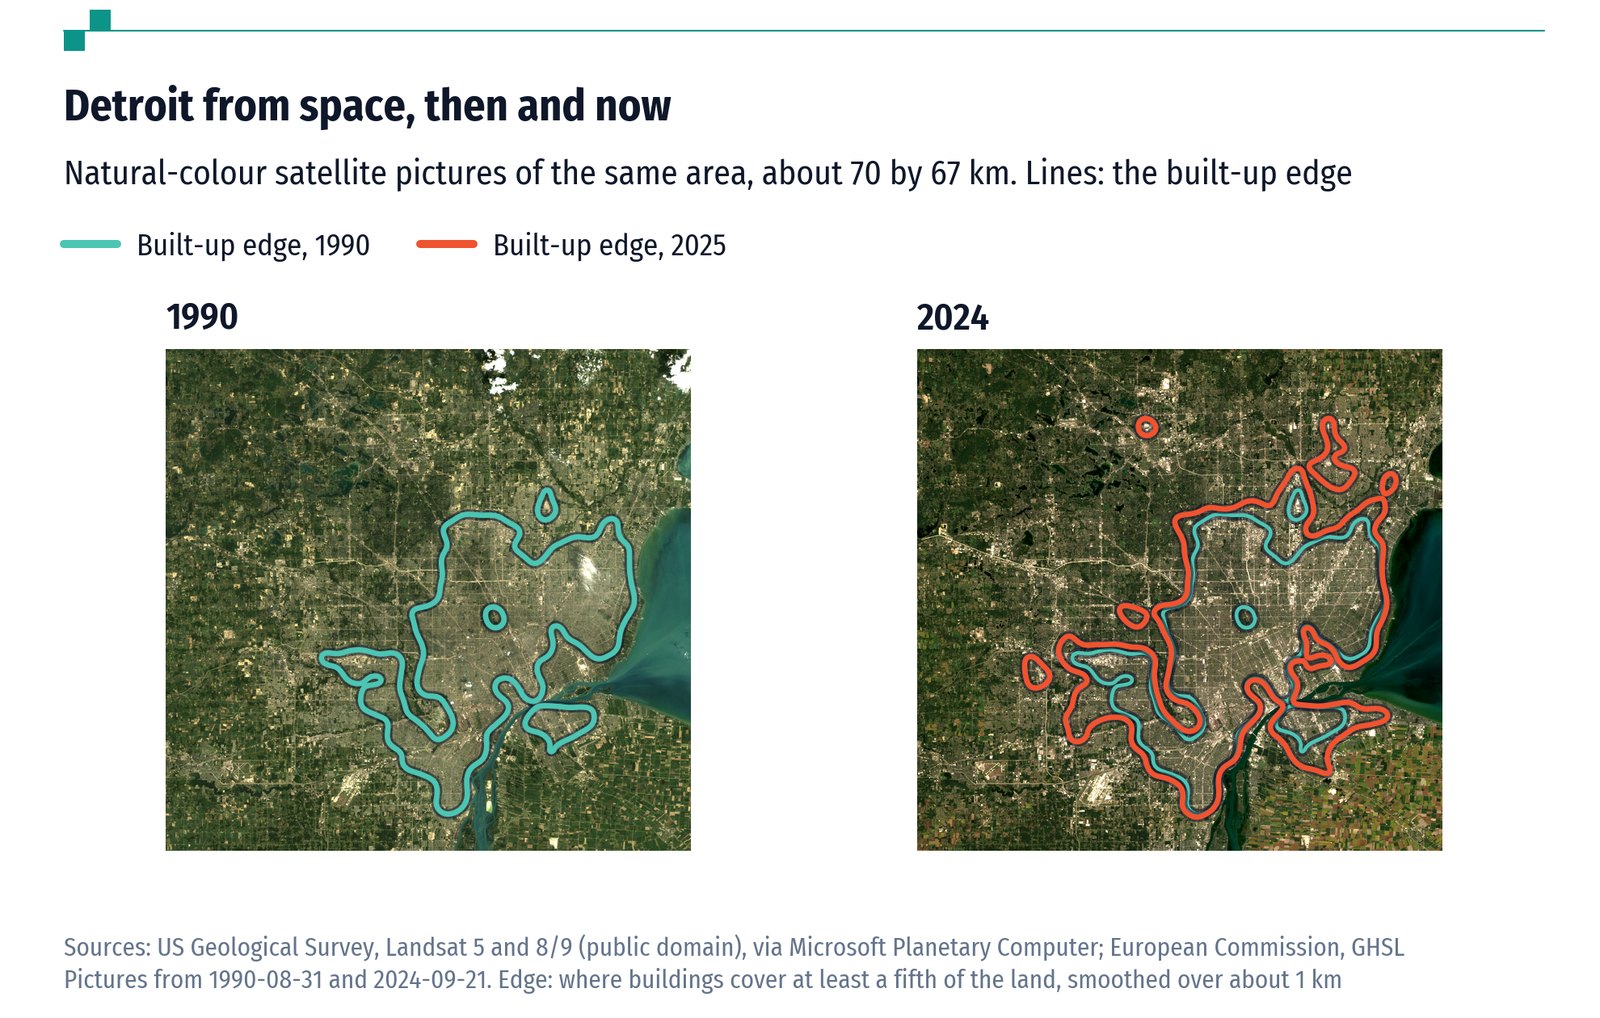
The older industrial metros went the other way. Detroit has 5% fewer residents than in 1975 and 65% more built-up land: 168 square metres for each of them, up from 97. Chicago's built-up land grew by 69%, Philadelphia's by 88% and Minneapolis-St Paul's by 115%, while their populations grew by a quarter to a half. New York's land per resident also rose, though from the lowest level of any American metro.
In all, people grew faster than land in 15 of the 25 metros. The United Nations tracks exactly this ratio, land growth against population growth, as one of its goals for sustainable cities. On that measure the metros going most clearly the wrong way are Detroit, Minneapolis-St Paul, Philadelphia and Chicago.
Three countries, three densities
The gap between countries dwarfs the change over time. The largest American metros use 118 square metres of built-up land per resident, about the same as fifty years ago. Canada's two largest, Toronto and Montreal, use 86. Mexico's four largest use 49, and Mexico City 41, about a quarter of what Phoenix uses even now.
Built-up land here means ground covered by buildings, not roads, parks or car parks, so the totals understate how much land a city really takes. But the satellites measure every city the same way, and on that measure the old story of the sprawling South is out of date. The sprawl of the past fifty years has been in the places that stopped growing.
Data
The 25 largest metro areas of the US, Canada and Mexico, 1975-2025
Built-up land and residents in each of the 25 largest metros, with growth, the UN's land-to-population ratio and land per resident. Coverage: 1975, 1990, 2000, 2010, 2020, 2025. Source: European Commission GHSL; own calculations. top25.csv
Every metro area of the US, Canada and Mexico, 1975-2025
Built-up land, built volume and residents inside every functional urban area of the three countries. Coverage: 443 metros, six years. Source: European Commission GHSL; own calculations. metros_by_year.csv
Largest metros by country, 1975-2025
Built-up land, volume and residents summed over each country's metros among the 25 largest. Coverage: The 25 largest metros grouped by country. Source: European Commission GHSL; own calculations. countries.csv
Satellite-based residents against the 2020 census, US metros
Residents inside each US outline (GHSL) against the census count of the nearest metropolitan statistical area. Coverage: 2020. Source: European Commission GHSL; own calculations. check_census.csv
All the files, with a README that explains every column, are in the data on GitHub, free to reuse with credit (CC BY 4.0).
Cite this work
Our articles and data visualisations rely on work from many sources. When citing this article, please also cite the underlying data sources, listed with the data.
Signum Average (2026) - "The Sun Belt filled in. The Rust Belt spread out" Published online at signumaverage.com. Retrieved from: https://signumaverage.com/articles/city-sprawl/ [Online resource]
@article{signumaverage-2026-10-31-city-sprawl,
    author = {{Signum Average}},
    title = {The Sun Belt filled in. The Rust Belt spread out},
    journal = {Signum Average},
    year = {2026},
    month = {oct},
    url = {https://signumaverage.com/articles/city-sprawl/},
    note = {Online resource}
}
Reuse this work freely
Text, charts and data on this page are published under the CC BY 4.0 licence: you may copy, adapt and republish them for any purpose, as long as you credit Signum Average. Third-party data keeps its original licence.