Why Tokyo's cherry trees now bloom before Kagoshima's
Japan's cherry blossom is coming earlier almost everywhere. In the far south it has stopped, because the winters there are now too mild to wake the buds
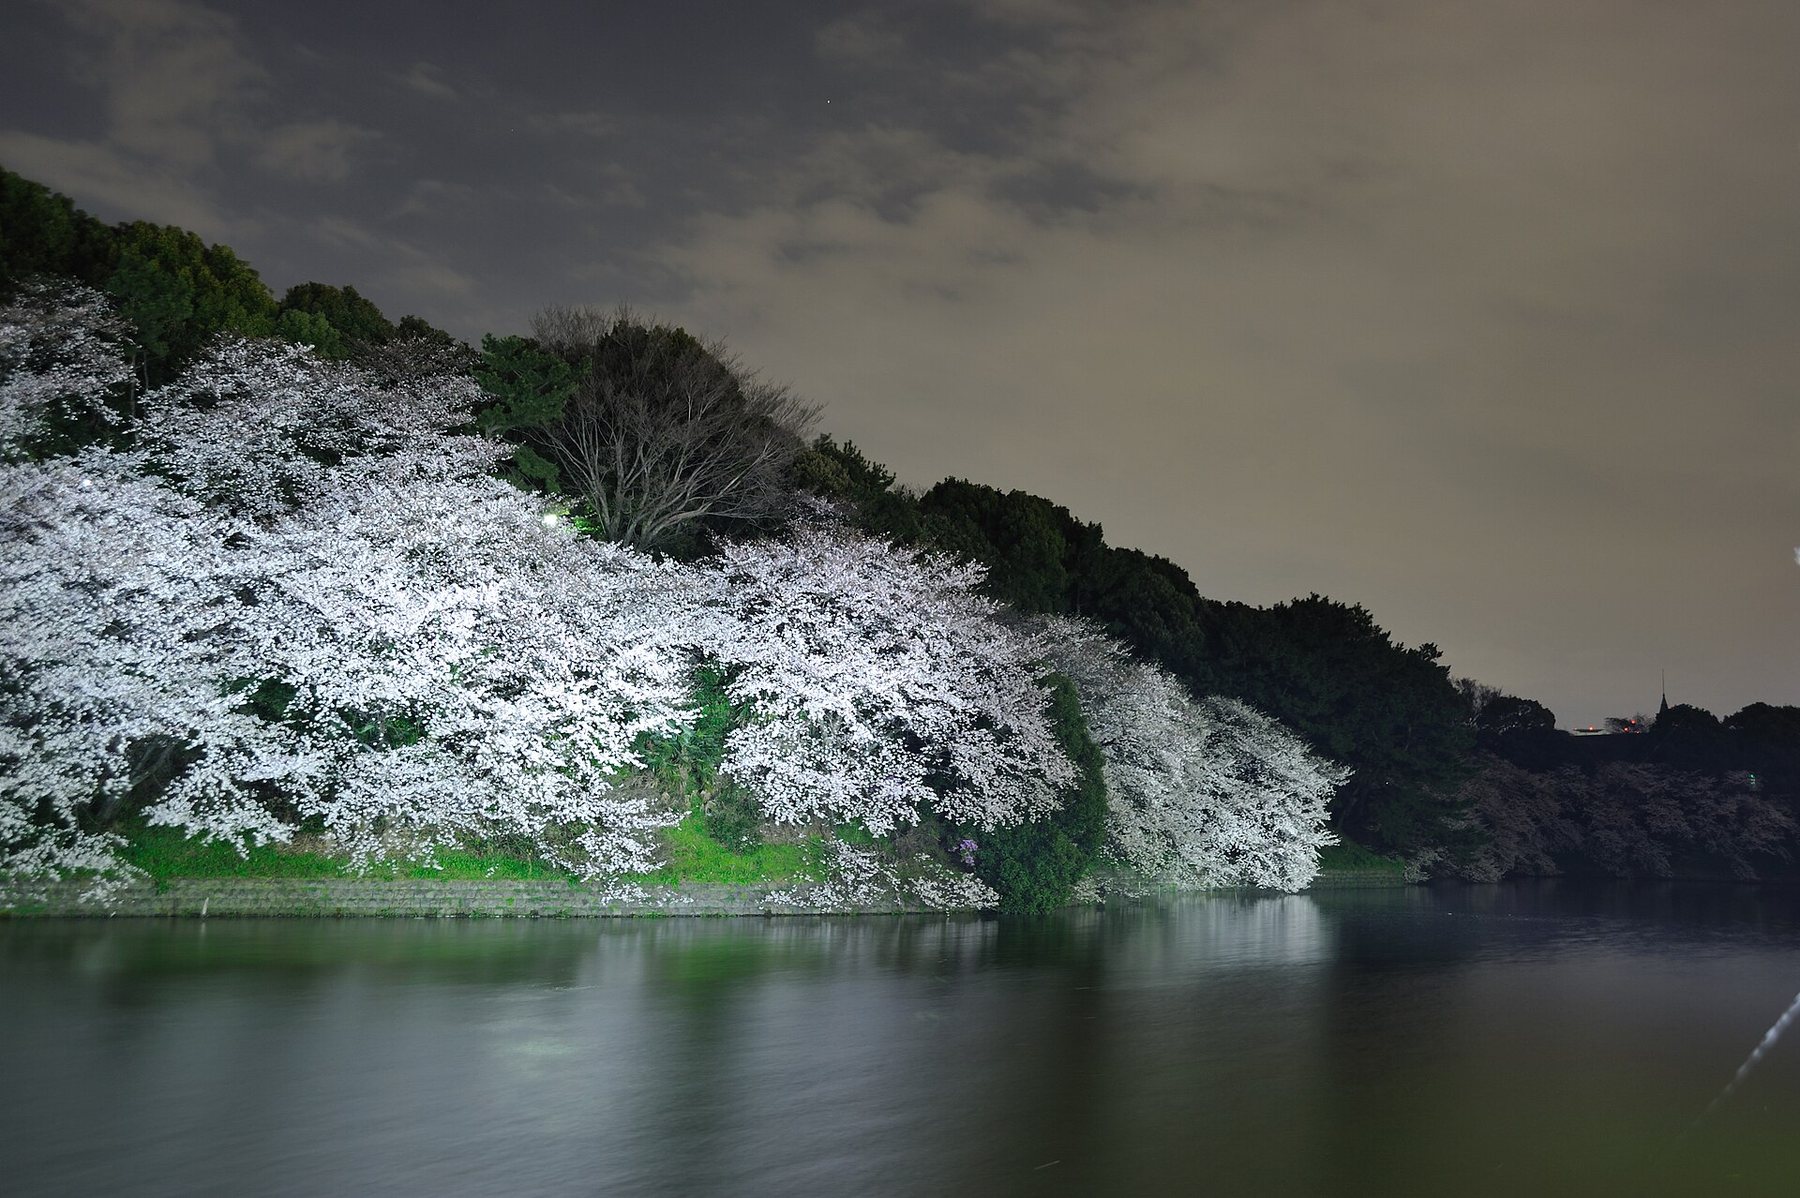
So many things
Matsuo Bashō (1644-94). Our translation
they bring back to mind,
the cherry blossoms
Each spring the staff of Japan's weather stations watch one marked cherry tree apiece. When five or six flowers have opened they declare first bloom. When four-fifths of the buds are open they declare full bloom. The Japan Meteorological Agency has kept these dates since 1953.
The records are unusually comparable, because nearly all the trees are the same tree. Somei Yoshino, the variety that lines Japan's rivers and castle moats, is spread by grafting, so every one is a genetic copy of the others. A difference in bloom date between two cities is a difference in weather, not in the plant.
We took the agency's dates for 80 stations and the daily temperatures at each since 1953. The well-known result holds: spring is coming earlier. At the 48 stations still observing, full bloom has moved forward by a little over a day a decade on average. In Sapporo it now comes on 28 April, not 9 May.
Where it stopped
The surprise is at the other end of the country. Of those 48 stations, 46 show a clear trend to earlier bloom. The two that do not are the two furthest south, Kagoshima and Miyazaki.
The result is that the blossom no longer arrives from the south. In 1956-65 the first five cities to reach full bloom were all on the southern islands of Kyushu and Shikoku, and Tokyo followed Kagoshima by three days. In 2016-25 Tokyo was 11 days ahead of it (the range of likely values is 7 to 15). South of Kyoto's latitude, full bloom used to come 1.7 days later for every degree further north. That slope has now vanished.
Kagoshima's trees are not clearly blooming later than they used to. Their trend is 0.3 days a decade the wrong way, too small to tell from none. What has happened is that they stood still while everywhere else moved.
Too warm to wake
The reason lies in the winter before. A cherry bud forms in summer and goes dormant. It needs a spell of cold to wake, and only then does spring warmth push it open. A mild winter leaves the bud half asleep, and it needs more warmth to flower.
The records show this station by station. For each one we asked how its first bloom moves when December and January are a degree warmer than usual, holding February and March fixed. In the coldest places the answer is not at all: winter there is always cold enough. In Kyoto a warmer winter delays the bloom by 1.3 days per degree. In Kagoshima it is 2.2 days, and on the warmest islands four or five. The milder a station's normal winter, the bigger the delay.
Spring warmth still pulls the other way, and harder: a degree in February and March brings Kyoto's bloom forward by nearly five days. So most of Japan keeps getting earlier. In Kagoshima the two effects are about the same size, and they cancel.
There is a second sign of trouble there. First bloom in Kagoshima is still creeping earlier, but full bloom is not, so the tree takes longer to open: 13 days from first flower to full bloom in the past decade, against seven in 1956-65. Researchers led by Toshio Katsuki, writing this year in the International Journal of Biometeorology, examined Somei Yoshino at this southern edge of its range and linked later and weaker flowering there to winters with too little cold. Our contribution is to show the same force at work, more weakly, across the whole country.
When, then?
This winter is a test. America's weather agency expects a strong El Niño, which tends to mean a mild winter in Japan, and Japan's own outlook is for a warm one. We built a forecast to see what that does to next spring: a model of winter cold and spring warmth, fitted to all 80 stations, fed 4,000 simulated winters.
Given the real weather, the model works. On the springs of 2001-26, which it had not seen, it missed full bloom by 3.1 days on average. A ten-year average missed by 4.1.
As a forecast it fails. Issued on 10 October it missed by 4.5 days, worse than the ten-year average. It was still worse on 1 March. It pulled ahead only from 15 March. Telling it about El Niño changed the score by two-hundredths of a day.
The date is decided by the weather in March, and nobody can see that from October. So we will not pretend to. The plain trend says 28 March for Tokyo, give or take six days, and 1 April for Kyoto. In April we will check both against the declared dates and publish how they did.
One export of the same tree offers a check. Most of Washington's cherries are Somei Yoshino too, descended from a gift from Tokyo in 1912. Fed Washington's weather, the model built on Japan's trees follows the ups and downs of its peak bloom closely, but runs five days early on average, for reasons we have not found. Identical trees, it seems, still keep some local habits.
Cite this work
Our articles and data visualisations rely on work from many sources. When citing this article, please also cite the underlying data sources, listed with the data.
Signum Average (2026) - "Why Tokyo's cherry trees now bloom before Kagoshima's" Published online at signumaverage.com. Retrieved from: https://signumaverage.com/articles/cherry-blossom/ [Online resource]
@article{signumaverage-2026-10-10-cherry-blossom,
    author = {{Signum Average}},
    title = {Why Tokyo's cherry trees now bloom before Kagoshima's},
    journal = {Signum Average},
    year = {2026},
    month = {oct},
    url = {https://signumaverage.com/articles/cherry-blossom/},
    note = {Online resource}
}
Reuse this work freely
Text, charts and data on this page are published under the CC BY 4.0 licence: you may copy, adapt and republish them for any purpose, as long as you credit Signum Average. Third-party data keeps its original licence.